CAMBODIA NATIONAL
LEVEL 1 SURVEY

4.2 Cost and Efficiency of Survey Methodology

The original estimate of time to complete the survey after completion of all preliminary work was 15 months, or 330 working days based on an average of 22 working days per month. Beginning in August 2000 the project would have been completed by October 2001. As described earlier, this estimate of the level of effort was based on assumptions concerning the application of False Negative Sampling and the elimination of almost 50% of all Cambodian villages from the Survey.

Rattana kiri Province

In this area the villages are widely scattered and the population is mainly ethnic hill tribe people. In this village the people speak Tumpun or at least that is the name of their tribe. The road to the village is very rough and slick. As this was a remote village two detachments (four surveyors), went together. We can't ride our motorbikes very easily as the bikes fell many times, especially when we were crossing streams. In these mountainous areas the rocks in the streams had a lot of algae growing on them, rock so we have to creep over them very slowly to avoid slipping. After we reached that village, we realised it had only a few people who were very surprised to see us coming. There were 8 large families and it looked as if everyone of the people had Hansen's bacillus. This is a disease that causes open sores in the skin all over the body. These people were miserable and got no help from the Provincial administration because no administration officials at the Commune office ever came to this village. They had no blankets, nor clothes. Our detachments felt very sorry for them and wanted to help them but we did not have much with us. So we took off our T-shirts, giving them to four persons, and small amount of medicine.

(By: Norm Sinath, Team Leader T4 and Surveyors)

After two Provinces had been surveyed it was becoming clear that many more villages than originally estimated were going to have to be surveyed. The pilot project in six selected Districts of Kandal and Takeo, some of the least contaminated Districts in Cambodia, which we surveyed in February 2001, showed conclusively that the FNS methodology could not be usefully applied in Cambodia. At that point we recommended to CIDA that either the geographic coverage of the Survey should be reduced, or the level of effort needed to be extended to complete full national coverage. The additional effort was estimated at five more months – extending the survey time from 15 to 20 months. CIDA quickly accepted the recommendation to complete the survey and committed to fund an extended level of effort.

Chart 1 below compares the levels of effort as estimated for the FNS based survey and the revised projected effort to complete the Census survey.


It might have been expected that by nearly doubling the number of villages to be surveyed, the level of effort also would be doubled. In fact the increased effort is almost exactly one third. The explanation is simple, nearly all the villages added to the Census survey are villages expected to have either low or no levels of contamination. Time required to survey such villages is much less than villages with contamination, especially suspected area contamination, which triggers the full socio-economic impact questionnaire.

The overall impact on the time to complete the survey is shown in Chart 2.


The actual number of working days estimated to be required in each case is 330 (15 months) for the FNS survey and 440 (20 months) for the Census survey.

A revised Calendar, was prepared showing the schedule for each Province. All survey time including time required to move and re-establish operations in each Province, stand down periods that allowed sufficient time for surveyors to return home and re-training time as required, is shown on this calendar.

Po Pesh Commune, Prey Veng district, Prey Veng Province

Sometimes we visited villages where the people had never before seen big motorcycles like the ones we were using. Nor did they understand about the compass and especially about the GPS. When we show them the GPS the children think it is magic. They made many jokes about it. Even about our motorcycles the children made comments such as, "Motor neck - same size as neck of my fathers' buffalo" because there was nothing else in their life to compare it to.

(By: Norm Sinath, Team Leader T4 and Surveyors)

Provinces were surveyed in the sequence projected until the rainy season of 2001 became so severe when survey was in the north-eastern Provinces that the order had to be adapted to allow the survey to work in areas above flood level. The reports in this section all have been adapted to show the actual sequence of survey operations.

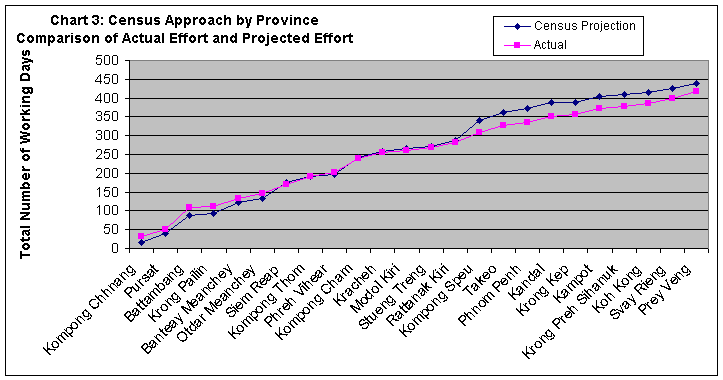
Chart 3 shows the number of days projected by the Calendar for the census survey accumulated for the entire survey period plotted against the actual time taken for each Province. The survey remained close to schedule throughout but for the first six Provinces was slightly behind schedule. Major gains on the schedule were made when the survey moved to the more densely populated and less contaminated provinces of the south and east. The gains would have been more dramatic except that a number of Provinces were partially revisited to ensure consistency throughout the survey, which slowed completion of the survey.


Takeo Province - Translated by Chau Touch San

On September 08, 2001, we followed the plan from our team leader to survey at Champol village in Popel commune, Tramkak district. After receiving the plan, we took breakfast and started working. We traveled toward the village in order to interview the village people. After we arrived at this village in a somewhat remote area and stopped our motorbikes, we asked a man we met to show us the house of the Village Chief. We also asked him about information concerning this village, in which he lived. Information that we asked him about was focused on landmines and unexploded ordnances (UXO). During our interview, he told us there weren't any mines nor UXO in his village any more and also there was good security. We asked him to give us his name as an information provider, but he hesitated at this. After we showed him our mission orders, he agreed to tell us his name. His name is Meas Hun, and he is a 60 years old farmer. We asked him to confirm for us that the name we had written for him was correct. He answered that it was correct. But we were a little suspicious of this man because of the way he answered us. So we asked him again if he is this man. It turned out that he could not know as he could not read and could not write. What he saw when he looked at his name was not writing but a picture in Khmer writing. This picture of his name looked like the same picture of his name made by the village chief and the commune chief writing his name, the same as we had written. Unfortunately we met many people like this man especially in remote parts of Cambodia. Even some Village Chiefs and sometimes Commune Leaders had the same problem of not being able to read and write.

(By: Tum Bunsam, DT34)

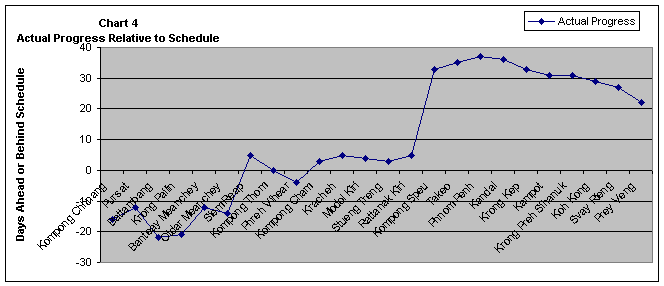
Chart 4 shows how far ahead or behind schedule the survey was at the completion of various Provinces. It shows that the survey varied from one month behind schedule in Battambang and Pailin to almost two months ahead of schedule in Takeo, Phnom Penh and Kandal. The L1S working month was twenty two days.

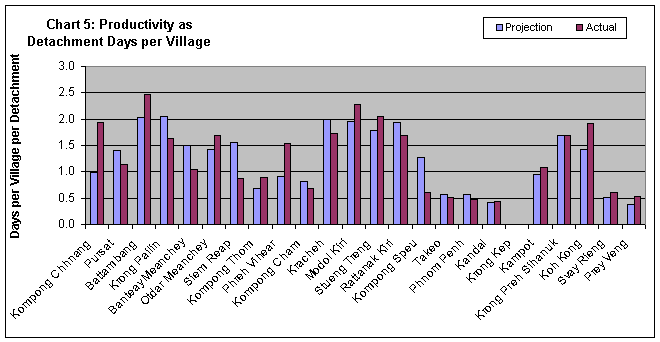
Each of the monthly progress reports showed all this information but also calculated the productivity of the survey in terms of days per village per detachment. As expected there was a large variation between the extremes of Battambang (2.46 days) and Kandal (0.44 days). The Progress Report for March 2002 is shown at the end of this section. It is the last month for which a progress report has been produced. Based on this information chart 5 (at the end of this section) was produced and productivity is expressed in terms of detachment days per village. It is compared with the productivity predicted by the project team at the time when the decision on the Census survey was taken.


Progress report summary (31st March 2002) completed provinces

Province

Days per village

Villages Projected

Villages with
Mines and/or UXO

Effort to Complete

Cumulative Time

(Progress indicator)

Days per Village

(Productivity indicator)


Days

No.

No.

No.

No.

Days

Days

Days

Days

Days

Days

Days

Days

Days


Original Productivity Target May 2000

FNS Survey May 2000

Census 1 Survey Dec.

2000

Actual Survey

Actual

Positive

Projected Calendar FNS Survey

Projected Calendar Census Survey

Actual Survey

Forecast FNS Survey

Forecast Census Survey

Actual Survey2

FNS Survey Targets

Census Survey Targets

Actual Survey

Kompong Chhnang

1.0

164

546

546

179

13

17

33

13

17

33

2.5

1.0

1.93

Pursat

2.0

470

495

504

129

20

22

18

33

35

51

1.4

1.4

1.14

Battambang

2.0

580

611

754

442

36

48

58

69

83

109

2.0

2.0

2.46

Krong Pailin

2.0

58

58

78

71

4

5

4

73

88

113

2.1

2.1

1.64

Banteay Meanchey

2.0

603

603

638

249

28

30

21

101

118

134

1.5

1.5

1.05

Otdar Meanchey

2.0

108

108

226

111

8

10

12

108

132

146

2.2

1.4

1.70

Siem Reap

2.0

794

882

908

226

38

44

25

146

176

171

1.5

1.6

0.88

Kompong Thom

1.3

295

737

748

309

15

16

21

161

192

192

1.6

0.7

0.90

Phreh Vihear

1.3

51

204

209

78

5

6

10

166

200

202

2.8

0.9

1.53

Kompong Cham

1.3

1,224

1,748

1,762

895

34

45

38

199

232

240

0.9

0.8

0.69

Kracheh

1.3

180

257

258

132

12

16

14

211

250

254

2.1

2.0

1.74

Modol Kiri

1.3

69

98

*98

29

5

6

7

216

257

261

2.1

2.0

2.29

Stueng Treng

1.3

90

128

125

49

5

7

8

221

264

269

1.9

1.8

2.05

Rattanak Kiri

1.3

168

240

247

110

11

15

13

232

286

282

2.1

1.9

1.68

Kompong Speu2

1.3

528

1,319

1,354

683

35

54

26

267

340

308

2.1

1.3

0.61

Takeo

1.3

112

1,116

1,116

485

6

20

18

273

360

326

1.7

0.6

0.52

Phnom Penh

1.0

159

637

669

125

9

12

10

282

372

336

1.8

0.6

0.48

Kandal

1.0

326

1,087

1,087

555

12

14

15

294

386

351

1.2

0.4

0.44

Krong Kep

1.3

16

16

16

9

2

2

**5

296

389

356

3.0

4.0

10.00

Kampot

1.3

72

481

502

223

4

15

**17

300

404

373

1.8

1.0

1.08

Krong Preh Sihanuk

1.3

51

85

95

26

4

5

**5

304

409

378

2.4

1.7

1.68

Koh Kong

1.3

77

129

134

58

5

6

**8

308

416

386

1.9

1.4

1.91

Svay Rieng

1.0

173

690

690

407

9

11

**13

317

427

399

1.7

0.5

0.60

Prey Veng

1.0

341

1,136

1,138

406

13

14

**19

330

440

418

1.2

0.4

0.53

Totals


6,709

13,411

13,902

6,327

330

440

418


418

1.57

1.05

0.96

Percent of Gazetteer villages (13,411)

50.0

100.0


Completion date:

October 2001

April

2002


Anticipated productivity at completion:

1.05

New villages to date:

491


3.7%


2 Provinces listed in actual chronological order of survey. Note that the original plan was changed after the survey in Rattanakiri (Day 282) due to the high flood levels in 2001.

Survey started August 2000; operations were suspended for two weeks in September 2000.

1 Census Survey Village numbers based on Gazetteer


* Mondol Kiri 17 villages were inaccessible, only 81 villages were visited in the original survey; remainder were visited March 02.

** Total days include revisits to villages in nine Provinces in December 2001, January, February and March 2002.

Days saved were used to resurvey Kampong Chhnang in March and April 2002.

NB - Number of days based on working days per month (22)and 32 detachments.


Next Section - 5.1 Quality Control and Quality Assurance Procedures
Back to Table of Contents